
Source code analysis is often misunderstood as a simple bug detector, but it's far more powerful. Modern analysis tools detect security vulnerabilities, performance bottlenecks, and code quality issues before code ever runs. This guide explains what source code analysis truly is, how it works under the hood, its strengths and limitations, and practical strategies for integrating it into your development workflow. Whether you're evaluating tools like Semgrep or CodeQL or building automated checks into CI/CD pipelines, understanding the mechanics and nuances of source code analysis helps you ship secure, high-quality applications faster.
Table of Contents
- Understanding Source Code Analysis: Definition And Core Mechanics
- Challenges And Nuances: Weaknesses And Contrasting Approaches
- Integrating Source Code Analysis Effectively In Development Workflows
- Explore Automated Source Code Analysis With VibeDoctor
Key takeaways
| Point | Details |
|---|---|
| Definition and scope | Source code analysis examines code without execution to find bugs, security flaws, performance issues, and code smells. |
| Core mechanics | Uses Abstract Syntax Trees, pattern matching, dataflow analysis, and Control Flow Graphs to model program behavior. |
| Strengths and limits | Excels at early detection of syntactic issues but misses runtime behavior and can produce false positives. |
| Tool selection | Pattern matching tools like Semgrep offer speed; semantic tools like CodeQL provide depth for complex vulnerabilities. |
| Integration strategy | Integrate incrementally into CI/CD, monitor false positive rates weekly, and combine with dynamic testing for comprehensive coverage. |
Understanding source code analysis: definition and core mechanics
Source code analysis, also known as static code analysis or Static Application Security Testing (SAST), is the automated examination of source code without execution to detect bugs, security vulnerabilities, style violations, performance issues, and code smells. Unlike dynamic testing, which runs your application to observe behavior, static analysis inspects the code itself. This allows you to catch issues early in the development cycle, often before code reaches production or even staging environments.
The goals of source code analysis extend beyond simple bug hunting. Security teams use it to identify injection flaws, hardcoded secrets, and insecure API calls. Performance engineers use it to flag inefficient algorithms and resource leaks. Code reviewers use it to enforce style guidelines and detect code smells like duplicated logic or overly complex functions. By automating these checks, development teams can maintain consistent quality standards across large codebases without manual inspection of every line.
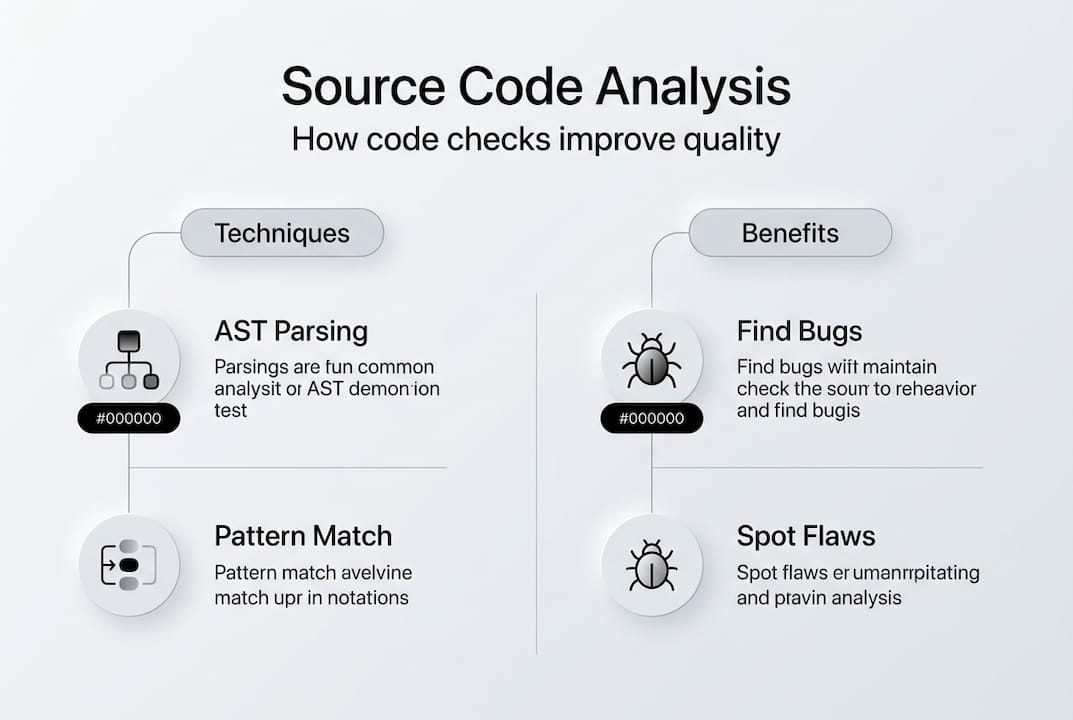
Core mechanics involve parsing source code into an Abstract Syntax Tree (AST), pattern matching for known defects, dataflow analysis to track variable states and taint propagation, control flow analysis via Control Flow Graphs (CFGs) to model execution paths, and advanced techniques like call graph analysis, path-sensitive analysis, and resource lifecycle tracking. The AST represents your code's structure as a tree of syntax elements, making it easy to identify patterns like missing null checks or unvalidated user input. Pattern matching applies predefined rules to detect common mistakes, such as SQL injection vulnerabilities or deprecated function calls.
Dataflow analysis tracks how data moves through your program. It identifies taint sources where untrusted input enters your application and traces that data to sensitive sinks like database queries or system commands. If untrusted data reaches a sink without proper sanitization, the tool flags a potential security vulnerability. Control Flow Graphs map all possible execution paths through functions, helping tools reason about conditional logic and loops. This enables detection of unreachable code, infinite loops, or missing error handling on certain paths.
Advanced techniques build on these foundations. Call graph analysis maps function invocations across your entire codebase, enabling interprocedural analysis that tracks data flows across multiple functions or modules. Path-sensitive analysis considers specific execution paths through conditionals, improving accuracy by understanding which code branches are reachable under different conditions. Resource lifecycle tracking monitors the allocation and release of resources like file handles, database connections, or memory, flagging potential leaks when resources aren't properly freed.
These mechanics enable automated code analysis checks to detect a wide range of issues:
- Security vulnerabilities like SQL injection, cross-site scripting, and hardcoded credentials
- Performance problems including inefficient algorithms, memory leaks, and unnecessary computations
- Code quality issues such as duplicated code, overly complex functions, and violation of coding standards
- Potential bugs like null pointer dereferences, array out-of-bounds access, and type mismatches
By understanding these core mechanics, you can better evaluate tools and configure them to match your project's specific needs and risk profile.
Challenges and nuances: weaknesses and contrasting approaches
While source code analysis is powerful, it faces real-world challenges that affect accuracy and performance. Edge cases include path explosion in path-sensitive analysis, interprocedural flows across modules, context-blindness to frameworks/ORMS, taint explosion, and poor performance on large/real-world code vs. synthetic benchmarks. Path explosion occurs when analyzing all possible execution paths through complex conditional logic becomes computationally infeasible. A function with multiple nested if statements and loops can have thousands or millions of potential paths, making exhaustive analysis impractical.
Taint explosion happens when tracking data flows through large codebases. As tainted data propagates through function calls and variable assignments, the analysis must track an exponentially growing set of tainted values. This can overwhelm tools or force them to make conservative approximations that increase false positives. Interprocedural flows across modules present another challenge. When functions call code in external libraries or frameworks, static analysis tools may lack visibility into those implementations, limiting their ability to track data flows accurately.
Context-blindness to frameworks and ORMs is particularly problematic for web applications. Many modern frameworks provide built-in sanitization or validation that static tools don't recognize. An ORM might automatically parameterize database queries, making SQL injection impossible, but a context-blind tool will still flag the code as vulnerable. This generates false positives that erode developer trust and waste time during code review.
Contrasting viewpoints: Pattern-matching (fast, local, e.g., Semgrep) vs. semantic (deep, slow, e.g., CodeQL); static excels at early syntactic issues but misses runtime behavior; over-reliance creates bottlenecks/false confidence, better as signal not gate; combining with dynamic/IAST reduces FPs. Pattern-matching tools like Semgrep use lightweight syntax rules to quickly scan code for known patterns. They excel at catching common mistakes and enforcing coding standards with minimal performance overhead. However, their simplicity limits their ability to understand complex data flows or reason about program semantics.
Semantic analysis tools like CodeQL build deeper models of program behavior. They understand type systems, track data flows across function boundaries, and can reason about complex interprocedural paths. This depth enables detection of sophisticated vulnerabilities that pattern-matching tools miss. The tradeoff is speed: semantic analysis requires more computational resources and takes longer to complete, making it less suitable for rapid feedback loops during development.
| Approach | Strengths | Weaknesses | Best Use Cases |
|---|---|---|---|
| Pattern Matching | Fast execution, low resource usage, easy rule creation | Misses complex flows, high false positives on framework code | Coding standards, simple bug detection, pre-commit hooks |
| Semantic Analysis | Deep vulnerability detection, framework awareness, low false negatives | Slow execution, high resource usage, complex setup | Security audits, complex codebases, release gates |
Static analysis alone misses runtime behavior. It can't detect race conditions, timing-dependent bugs, or issues that only manifest with specific input data or environmental conditions. Over-reliance on static analysis creates bottlenecks when teams treat findings as hard blockers rather than helpful signals. Expert practitioners recommend using static analysis as one signal among many, not as a gatekeeper that prevents all deployments. Combining static testing with dynamic and Interactive Application Security Testing (IAST) reduces false positives by validating findings against actual runtime behavior.
Pro Tip: Tune your analysis rules for your specific frameworks and custom sanitizers. Most tools allow you to define custom patterns or taint sinks that match your application's security controls. Investing time in configuration upfront dramatically reduces false positives and increases developer adoption. Review and update these rules quarterly as your codebase and frameworks evolve.
For more insights on balancing different analysis approaches, explore static analysis research and compare static analysis tool features to understand which capabilities matter most for your use cases.
Integrating source code analysis effectively in development workflows
Successful integration of source code analysis requires thoughtful planning and incremental adoption. For web app security/performance, prioritize tools with low FP rates (<20%), framework awareness, and CI integration; start with Semgrep for speed, CodeQL for depth; tune rules for custom sanitizers. Begin with fast, lightweight tools that provide immediate value without disrupting developer workflows. Semgrep is excellent for catching common mistakes and enforcing coding standards in pre-commit hooks or pull request checks. Its speed makes it suitable for rapid feedback, and its simple rule syntax allows teams to customize checks without deep expertise.
As your team gains confidence with static analysis, add deeper semantic tools like CodeQL for security-critical code paths or release gates. CodeQL's ability to model complex data flows makes it valuable for detecting sophisticated vulnerabilities like second-order SQL injection or cross-site scripting through indirect taint propagation. However, its longer analysis time makes it better suited for nightly builds or release branches rather than every commit.
Practical guide: Integrate incrementally in CI/CD as 'signal' not blocker; measure FP rate weekly; combine SAST+DAST for web apps to cover static limits. Start by running analysis in advisory mode where findings generate warnings but don't block builds. This allows developers to familiarize themselves with the tool and its findings without creating friction. Monitor false positive rates weekly by sampling findings and categorizing them as true positives, false positives, or irrelevant. If your false positive rate exceeds 20%, investigate whether rule tuning or tool configuration can improve accuracy.
Integrate source code analysis progressively into CI/CD pipelines to avoid bottlenecks. Run fast checks on every commit, medium-depth checks on pull requests, and comprehensive checks on release branches. This tiered approach balances speed and thoroughness, ensuring developers get rapid feedback on common issues while security-critical code receives deeper scrutiny. Use caching and incremental analysis features to analyze only changed code when possible, reducing analysis time for large codebases.
Follow these best practices for effective integration:
- Start with a baseline scan to understand your current codebase's state and prioritize high-severity findings.
- Configure tools to recognize your frameworks' built-in security controls, reducing false positives from framework-protected code.
- Define custom rules for project-specific patterns like internal sanitization functions or security wrappers.
- Establish clear ownership for triaging findings, typically assigning security issues to the security team and code quality issues to tech leads.
- Create feedback loops where developers can mark false positives, and security teams review these markings to improve rules.
- Combine static analysis with dynamic testing to validate findings and catch runtime-only issues.
- Track metrics like time to remediation, false positive rate, and developer satisfaction to continuously improve your analysis program.
Use dataflow and taint analysis particularly to detect injection and security flaws. These techniques excel at identifying vulnerabilities where untrusted input reaches sensitive operations without proper validation. Configure your tools to recognize your application's input sources (HTTP parameters, file uploads, database reads) and sensitive sinks (SQL queries, system commands, file operations). Define custom sanitizers that your codebase uses to validate or escape data, ensuring the tool understands when taint has been properly handled.
Combine static (SAST) and dynamic (DAST) testing for comprehensive web app security. Static analysis catches issues in code structure and logic, while dynamic testing validates runtime behavior and configuration. DAST tools can confirm whether static findings are exploitable in your deployed environment, helping prioritize remediation efforts. Interactive Application Security Testing (IAST) bridges the gap by instrumenting your application during testing to observe actual data flows and validate static findings with runtime context.
Pro Tip: Treat static analysis findings as helpful signals rather than automatic blockers. Not every finding requires immediate remediation. Prioritize based on severity, exploitability, and business context. A low-severity code smell in rarely-executed code matters less than a high-severity SQL injection in a public-facing API. Empower developers to make informed decisions about which findings to address and when, while maintaining clear escalation paths for security-critical issues.
Explore automated code checks to see how comprehensive analysis can be integrated into your development workflow without overwhelming your team.
Explore automated source code analysis with VibeDoctor
VibeDoctor offers over 129 automated code analysis checks covering security, performance, and code quality to help development teams ship better applications. By connecting your GitHub repository, you receive instant diagnostic reports that identify vulnerabilities, performance bottlenecks, and code smells across your entire codebase. The platform integrates seamlessly with CI/CD pipelines, providing continuous analysis without requiring manual setup or maintenance.
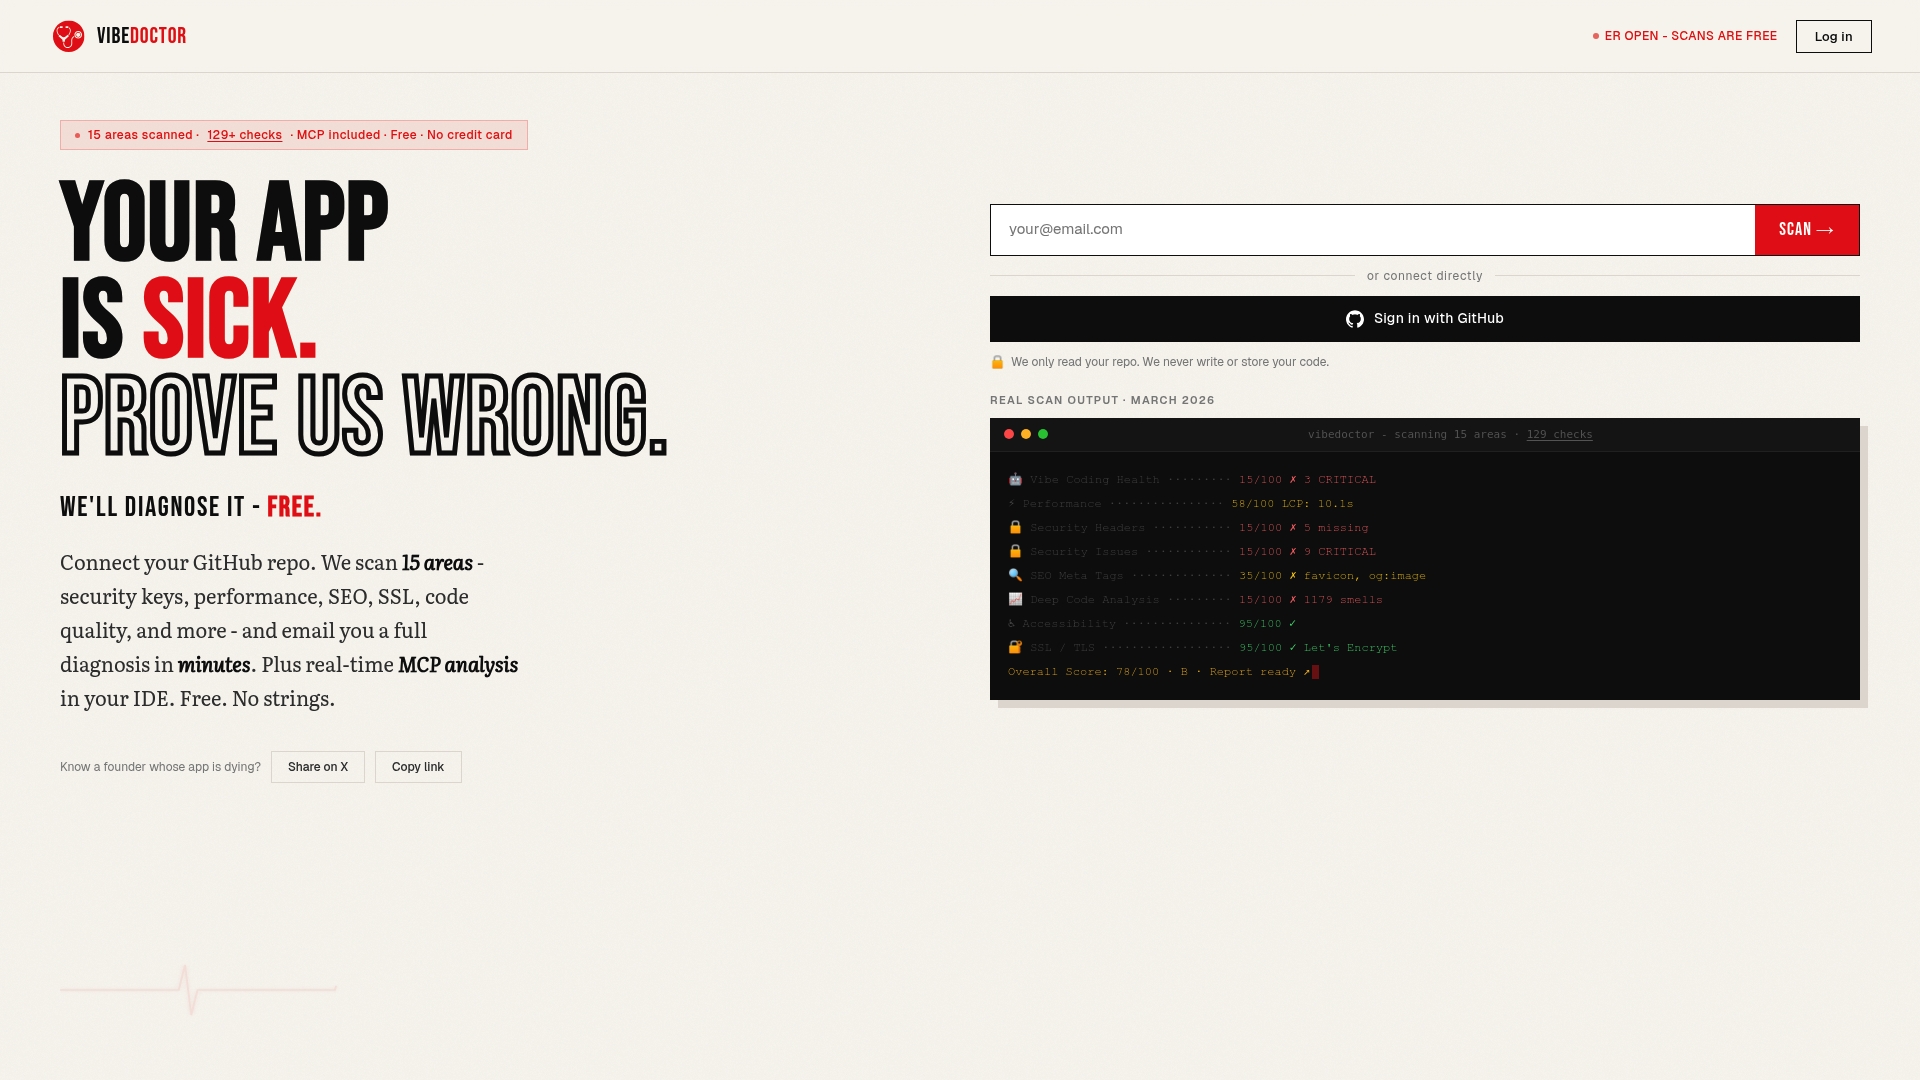
AI-powered technology balances depth and speed, minimizing false positives while catching complex issues that traditional pattern-matching tools miss. VibeDoctor's analysis covers security headers, API key leaks, performance metrics, and deep code analysis, giving you comprehensive visibility into application health. Access the free AI code scanner to start improving your codebase today. The platform provides actionable fix recommendations and integrates with IDEs via MCP for real-time feedback as you code, making security and quality improvements a natural part of your development workflow.
Frequently asked questions
What is static analysis and how does it differ from dynamic analysis?
Static analysis examines source code without executing it, using techniques like AST parsing and dataflow analysis to detect potential issues. Dynamic analysis tests applications by running them with various inputs and observing behavior. Static analysis catches structural problems and common vulnerabilities early in development, while dynamic analysis validates runtime behavior and configuration. Both approaches complement each other: static analysis provides broad coverage of code paths quickly, while dynamic analysis confirms whether issues are exploitable in real environments.
How can false positives be minimized when using source code analysis tools?
Tune rule sets for project-specific patterns by defining custom sanitizers and framework-aware configurations that recognize your security controls. Integrate testing incrementally, starting in advisory mode to measure false positive rates before enforcing findings as build blockers. Combine static tools with dynamic testing to validate findings against actual runtime behavior, filtering out issues that aren't exploitable in your environment. Review and update configurations quarterly as your codebase evolves, and create feedback loops where developers can report false positives for security team review.
Which source code analysis tools are recommended for web application security?
Semgrep excels at lightweight, fast pattern matching for common vulnerabilities and coding standard enforcement, making it ideal for pre-commit hooks and rapid feedback. CodeQL provides deep semantic analysis that tracks complex data flows across function boundaries, detecting sophisticated vulnerabilities that pattern-matching tools miss. Combine both tools for comprehensive coverage: use Semgrep for speed and broad detection, then apply CodeQL for security-critical code paths and release gates. Prioritize tools with framework awareness and low false positive rates under 20% to maintain developer trust.
What are common challenges faced by static code analysis in large projects?
Path and taint explosion issues occur when analyzing all possible execution paths becomes computationally infeasible, forcing tools to make conservative approximations that increase false positives. Handling interprocedural and framework contexts is difficult when functions call external libraries or frameworks that tools can't analyze, limiting visibility into data flows. Performance and scalability limitations emerge on large, real-world codebases where analysis times can exceed acceptable thresholds for CI/CD integration. Address these challenges through incremental analysis of changed code, caching results, and tiered analysis strategies that balance speed and depth based on code criticality.